
Concessional development finance, and Official Development Assistance (ODA) in particular, remains crucial for many countries’ progress—but what do we know about its effectiveness? In two recent analyses, colleagues and I at the Center for Global Development have looked at both the value of Finance for International Development for all major economies, and for a smaller group who report in more detail, we assess the Quality of Official Development Assistance (QuODA).
Here, we look at the who now provides development finance, and whether it has improved since the Busan agreement to improve effectiveness almost ten years ago, and the creation of the Global Partnership for Effective Development (also known as The Global Partnership).
Development finance broader than the DAC
We estimate that total cross-border concessional development finance amounted to $156.6bn in the most recent year with data available (2018), and around a sixth (17 percent) is provided by countries outside the OECD’s Development Assistance Committee (DAC). This of course includes China, though the relatively less-concessional-nature of their finance means that on a grant-equivalent basis, we estimate their (annual) effort at some $5.7bn, and just 0.04 percent of GNI. Other notable efforts outside the DAC include Saudi Arabia, Turkey, and the UAE, who each contribute over 0.5 percent of their national income (GNI).
Figure 1. Finance for International Development as a share of GNI (2018)
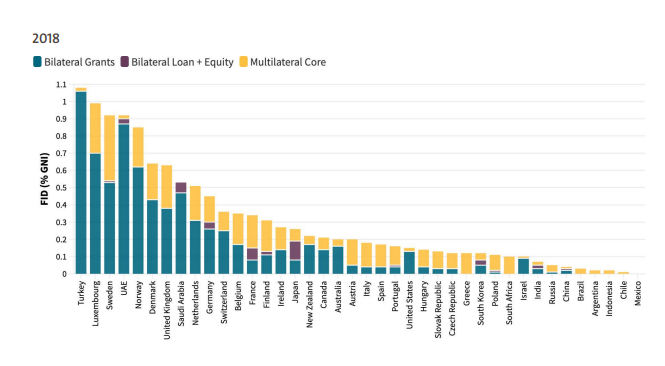
Source: Ritchie, Hughes and Mitchell (2021), Center for Global Development
Whilst it is possible to make comparisons using national data, as we do, for many of the countries outside the DAC, reporting is sporadic and incomplete. Of the eight countries that do not report to the DAC, just three make data available within two years, only half make clear which countries receive support, and none provides project detail.
A major step forward then would be for those countries outside of the DAC to commit to publishing their data within 18 months and providing recipient and instrument data. These would surely be of value to recipient countries, as well as scholars and the providers themselves.
The Global Partnership’s monitoring survey of partner countries remains a key resource to understanding objective alignment, use of country systems, and reliability of finance (see below). Though coverage could improve substantially, and we urge the Partnership to be consistent in its questions (to allow comparisons over time) and to support improved response rates.
What about effectiveness and quality of development finance?
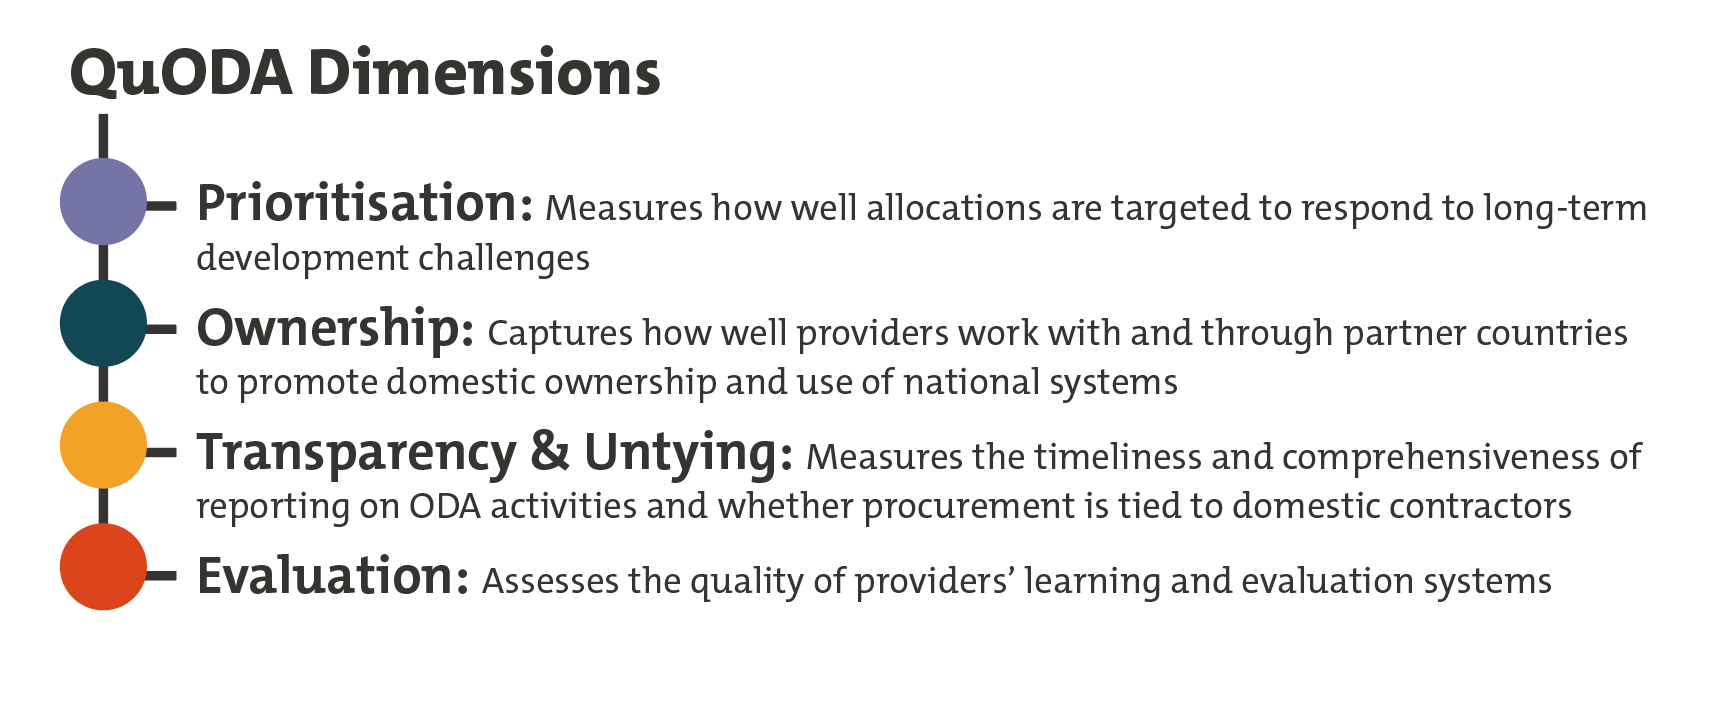
For those who are members of the DAC, we can take a more detailed look at indicators of quality. In our first new Quality of ODA (QuODA) assessment since 2014, we look at what we think are the most important indicators of finance quality for 29 countries and the 20 international agencies across four dimensions:
Figure 2: QuODA Dimensions
You can see the results for each agency using our online tool here, and tailor your ranking by adjusting which indicators you want included.
But as we approach ten years from the Busan Agreement for Effective Development Cooperation, what are the wider trends in these dimensions?
Quality of ODA since Busan
Taking each of our quality dimensions in turn, we can gain a picture of overall trends in ODA quality. Historic data has not been compiled on the Evaluation dimension, but on the other three we can gain a sense of progress.
First, on Prioritisation—there is little sign of meaningful progress. Taking two key indicators—the share of ODA that reaches partner countries, and the average income level of those receiving it—there is little sign of improvement.
Figure 3: Share of ODA Reaching Recipient Countries
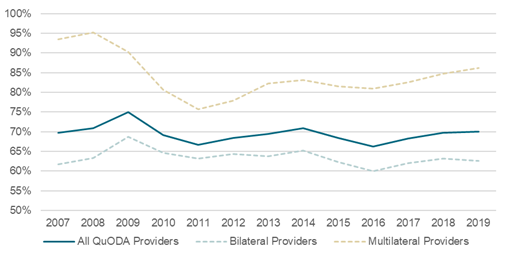
Source: Authors’ calculations, based on the OECD Creditor Reporting System and Country Programmable Aid datasets, see methodology (P1) for full details
Figure 4: Average GNI per capita of ODA Recipients (2017 USD, PPP)
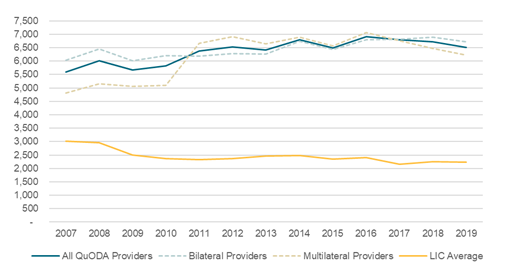
Source: Authors’ calculations, using the World Bank’s WDI database, CIA World Factbook, and OECD CRS database
The share of ODA reaching partner countries has flatlined around 70 percent over the past decade (2010-2019). The average income of those reached with this assistance has increased and has risen to more than double the low-income country average.
Despite calls to leave no-one behind and eradicate extreme poverty as part of the Global Goals, there has been no discernible shift in resources towards those most in need.
Second, on Ownership, we draw almost exclusively on Global Partnership monitoring data, and, whilst that survey’s coverage is partial, it’s difficult to see much—if any—improvement across the key indicators.
Figure 5: Ownership indicators, average across all agencies
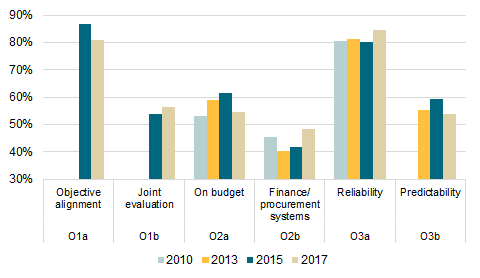
Source: Simple average of scores for QuODA agencies on GPEDC indicator 1a.1 (QuODA O1a), 1a.4 (QuODA O1b), 6.1 (QuODA O2a), 9b (QuODA O2b), 5a.1 (QuODA O3a) and 5b (QuODA O3b). See full QuODA methodology for full indicator definitions. Sample size differs across indicators and years based on data available.
Finally, on Transparency and Un-tying, there has been some positive progress. On transparency, reporting to the OECD does appear more complete, and membership of the International Aid Transparency Initiative (IATI) has increased substantially. In 2019, 33 of QuODA’s 49 providers reported to IATI (up from 21 in 2009), with those sharing information doing so on some 61 percent of their ODA (up from 46 percent in 2009).
On Un-tying, progress appears positive, although new analysis suggests unofficial tying remains a significant problem. Evidence suggests tied assistance may be a quarter less effective but DAC members reported that 78 percent of their ODA was not tied to national companies—up from 74 percent in 2010. Still, this masks that for many providers—and over half the total at 57 percent—is contracted with a national provider. That statistic does not suggest an efficient and open contracting process for delivering international projects and we were also surprised to learn that one or two development banks limit their procurement to their companies based in shareholder countries.
Across the three dimensions of ODA quality we consider, there’s some progress on Transparency, and a mixed picture on Un-tying, but no sign of progress on Prioritization or Ownership. Overall, I’d suggest progress is very disappointing.
Where next on development effectiveness?
For providers outside the DAC, who are providing a quarter of development finance, the information needs to be made available in a more timely and systematic way for partners, particularly recipient countries, to be able to understand finance. A partnership could agree to provide a simple framework of this information, while maintaining a distinction from the greater demands of ODA reporting.
For DAC members, the onus needs to be on action. There has been little meaningful progress since Busan, and they can make substantial progress on prioritising based on need, dispersing funds through high-performing multilaterals, un-tying their contracting, and—especially with a focus on climate—ensuring their spending aligns with partners plans and strengthens their systems.
This autumn will mark a decade from the agreement at Busan on principles of effective development cooperation. Leaders talk about leaving no-one behind and doing more with less; if they are serious about putting tax-payers money to work changing and even saving lives, then they will need to turn warm words into hard action.